What is an IDE (Integrated Development Environment)? Which two IDEs would I suggest? What is jGrasp and how do you download and install it? You can find out in my previous article by clicking here.
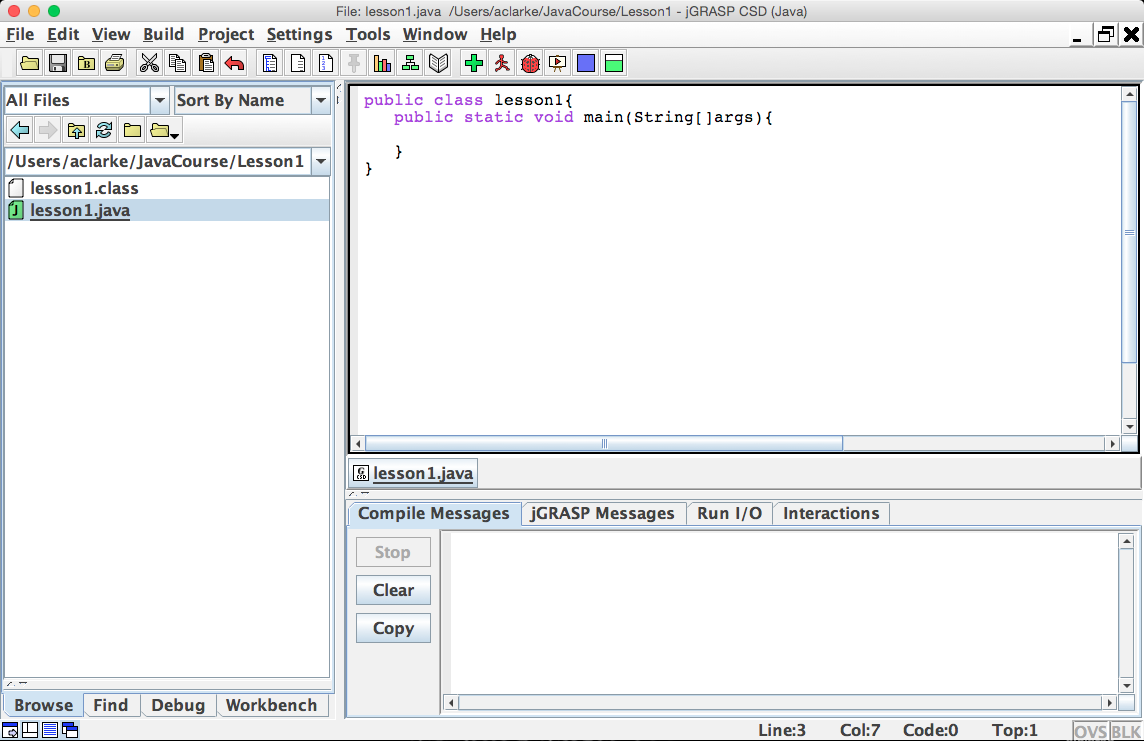
This is where I left off with jGrasp in my article Getting Started with Coding in Java:
The buttons we are going to use (Shortcuts are for mac):
Running Your Code in jGrasp
When you have written your code you have to first save and compile it. You can do this either by using the above mention shortcuts or by pressing the accompanying buttons. After saving and compiling you should receive a message like this:
Once you have this message that tells you that there are no coding errors (This does not mean there are no logic errors. Code can still run even if it does not work the way it is supposed to), you are in the clear to run your code. Do this by using the shortcut or by pressing the button.
Debugging Your Code
Debugging is used to de-bug your code (A bug is an error in the code). We can debug the code by placing break points. You can place break points by putting your mouse on the side line and clicking. It should look like this when a break has been placed:
You can now step from line to line and run the code slowly. The debugging tool will allow you to see specifically where the error lies in your code.
Generating a UML Class Diagram
Generating a UML (Unified Modelling Language) diagram allows you to view your code as a diagram similar to a mind map where it shows the connections and what each method or class contains. This is not necessary, it is just a useful way of showing a break down of the code. You can do this by simply clicking the aforementioned button.


